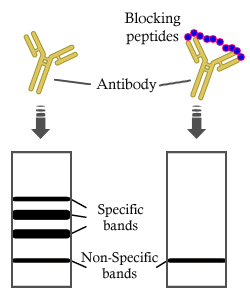
 . The lane on the left was treated with blocking peptide.")


 MAPK- and (B) pyroptosis-related proteins were assessed using western blot analysis. ***P")
 Western blot detection of NLRP3, caspase-1, GSDMD and GSDMD-N protein contents in HK-2 cells treated with 0.8 mM oxalate for 24 h after transfection with NLRP3-siRNA. (B) Relative lactate dehydrogenase levels in HK-2 cells transfected with NLRP3-siRNA upon 0.8 mM oxalate treatment for 24 h (n=6). (C) Images of two colors (blue and green) and merged colors in HK-2 cells with TUNEL staining were observed by confocal microscopy. HK-2 cells with NLRP3 silence were treated with 0.8 mM oxalate for 24 h followed by staining. Scale bars, 100 µm. (D) Images of three colors (blue, green and red) and merged colors in HK-2 cells with Calcein-AM/PI staining were recorded through confocal microscopy. HK-2 cells transfected with NLRP3-siRNA or scrambled-siRNA were dealt with 0.8 mM oxalate for 24 h. Scale bars, 100 µm. NLRP3, leucine-rich repeat-containing family pyrin domain-containing 3; GSDMD, gasdermin D; siRNA, small interfering RNA; Ctrl, control; NC, negative control.")
 Von Kossa staining revealed oxalate crystals in kidney of mice treated with Gly. (B) Haematoxylin and eosin staining demonstrated renal epithelial cell swelling, renal tubule edema and neutrophil infiltration in Gly treated mice. Scale bars, 50 µm. (C) Serum creatinine level of Gly-treated mice was examined by creatinine assay (n=6). (D) Western blot analysis of indicated proteins in NLRP3-GSDMD pathway in oxalated crystal mice. (E) The expression of same proteins was detected through immunohistochemical assays in mice. Scale bars, 50 µm. GSDMD, gasdermin D; Gly, glyoxylic acid; NLRP3, leucine-rich repeat-containing family pyrin domain-containing 3; OPN, osteopontin; Ctrl, control.")

 were incubated with 25 mmol/L glucose for 24 h to construct a T2DM cell model. (A) ELISA was performed to determine the insulin level to evaluate whether the modeling was successful. (B) GSDMD-N immunofluorescence staining was performed to detect cellular pyroptosis after adding 100 ng/mL irisin, followed by incubation for 24 h. (C) Western blotting assays were performed to detect the levels of C-caspase-1 and GSDMD-N. (D) Semi-quantitative analysis of proteins was performed. (E) Caspase-1 activity was detected. (F) ELISA was performed for detecting the level of secretion of IL-1β and IL-18 proteins; ***p")
 were incubated with 25 mmol/L glucose for 24 h to construct a T2DM cell model. (A) ELISA was performed to determine the insulin level to evaluate whether the modeling was successful. (B) GSDMD-N immunofluorescence staining was performed to detect cellular pyroptosis after adding 100 ng/mL irisin, followed by incubation for 24 h. (C) Western blotting assays were performed to detect the levels of C-caspase-1 and GSDMD-N. (D) Semi-quantitative analysis of proteins was performed. (E) Caspase-1 activity was detected. (F) ELISA was performed for detecting the level of secretion of IL-1β and IL-18 proteins; ***p")
 NLRP3, (B) caspase-1, (C) gasdermin D (GSDMD)-N, (D) IL-1β, and (E) NR3C2 in aldosterone-perfused mouse aortic VSMCs to examine pyroptosis. (F) NLRP3, caspase-1, GSDMD-N, IL-1β and NR3C2 protein expression was detected via Western blotting. Scale bar = 50 μm. n = 6. The values are the means ± SDs, * p < 0.05 compared to CON, ** p < 0.01 compared to CON, # p < 0.05 compared to ALD, and ## p < 0.01 compared to ALD. ALD: aldosterone perfusion. After 7 days of adaptive feeding, an osmotic minipump (ALZET model 2006, DURECT Corporation, Cupertino, CA, USA) was implanted (s.c.) to infuse aldosterone (0.75 μg/h) for 12 weeks. ESA: aldosterone-perfused mice were administered esaxerenone (kindly provided by Daiichi Sankyo Co., Ltd., Tokyo, Japan) at 1 mg/kg/d.")
 NLRP3, (B) caspase-1, (C) gasdermin D (GSDMD)-N, (D) IL-1β, and (E) NR3C2 in aldosterone-perfused mouse aortic VSMCs to examine pyroptosis. (F) NLRP3, caspase-1, GSDMD-N, IL-1β and NR3C2 protein expression was detected via Western blotting. Scale bar = 50 μm. n = 6. The values are the means ± SDs, * p < 0.05 compared to CON, ** p < 0.01 compared to CON, # p < 0.05 compared to ALD, and ## p < 0.01 compared to ALD. ALD: aldosterone perfusion. After 7 days of adaptive feeding, an osmotic minipump (ALZET model 2006, DURECT Corporation, Cupertino, CA, USA) was implanted (s.c.) to infuse aldosterone (0.75 μg/h) for 12 weeks. ESA: aldosterone-perfused mice were administered esaxerenone (kindly provided by Daiichi Sankyo Co., Ltd., Tokyo, Japan) at 1 mg/kg/d.")
 The infarct volume was determined by TTC staining (n = 4). (C) The statistical analysis of neurological score (n = 4). (D–K) Protein expression of GSDMD-N, IL-1β, MMP9, occludin, iNOS, ARG1, BAX and Bcl2 after miR-628 treatment was measured by western blot (n = 4). (L–N) IF staining was conducted to analyse C3 and S100A10 after phenotypic induction for 3 days. (O–Q) Protein expression of C3 and S100A10 after phenotypic induction for 3 days. (R) Typical TEM images of astrocyte-derived exosomes. Scale bar = 100 nm. (S) Content and size of exosomes shown by NTA. (T) The levels of the astrocyte exosome markers ALIX, TSG101 and CD9 were detected by western blotting. The results are presented as the means ± SDs. *p")
")
 Cardiomyocyte viability after treatment of different concentrations of Dox measured with CCK-8 assay. (B) RT-qPCR and western blotting to detect FTO expression in cardiomyocytes after Dox treatment. (C) RT-qPCR and western blotting to test FTO expression in cardiomyocytes after upregulation or knockdown of FTO. (D) Flow cytometry to examine apoptosis. (E) Detection of LDH expression. (F) Expression of inflammatory factors (IL-18, IL-1β, TNF-α, and IL-6) determined with ELISA. (G) Expression of oxidative stress-related indicators (MDA and SOD). (H) Western blotting analysis of pyroptosis-related proteins (NLRP3, ASC, cleaved caspase-1, and GSDMD-N). (I) Immunofluorescence staining to measure the pyroptosis protein NLRP3. Data were expressed as mean ± standard deviation. Cell experiments were performed three times. Normally distributed data between two groups were compared with the unpaired t-test and among multiple groups were compared with one-way analysis of variance. Tukey’s test was used for post hoc analysis. *, P")

 for 24 h each. (A–C) The fluorescence intensity of TXNIP, NLRP3 and GSDMD was detected by immunofluorescence staining. The green color represented TXNIP, NLRP3 and GSDMD staining. (D) The levels of TXNIP mRNA expression were detected by qRT-PCR. (E) The expression of TXNIP, NLRP3, caspase 1, cleaved-caspase 1, GSDMD and GSDMD-N were detected by Western blotting, and their expression was normalized relative to β-actin. Results are mean ± SD (n = 3). #P < 0.05, ##P < 0.01 vs. CON group; *P < 0.05, **P < 0.01 vs. FFA group.")
 CON (drinking water), (ii) PBS (PBS) (iii) DSS (3 % DSS), (iv) L(3 % DSS and BNE 50 mg/kg/d), (v) M (3 % DSS and BNE 100 mg/kg/d), and (vi) H (3 % DSS and BNE 200 mg/kg/d). n = 3. Representative western blot images (A) and quantification of (B) caspase-1, (C) ASC and (D) GSDMD-N protein expressions. β-actin was used as a normalization control. Quantification of NLRP3 (E) and GSDMD-N (F). The effect of BNE on the expression of NLRP3 (G) and GSDMD-N (H) was evaluated in the mouse colon by IHC (100 ×). BNE inhibited the expression of pyroptosis-related proteins in the colon of DSS- induced mice. Data are expressed as mean ± SEM. #p")
 The relative protein expressions of NLRP3, GSDMD-N, caspase-1, IL-1β, and IL-18 in liver tissues were examined by western blotting. Data were expressed after being normalized with β-actin. (b) The concentrations of TNF-α, IL-1β, and IL-18 in liver tissues were measured by ELISA. (c) The level of F4/80 was detected by immunofluorescence assay. Scale bar = 200 µm. *p < 0.05,**p < 0.01 ***p < 0.001 vs. sham + TAGLN2 WT; #p < 0.05, ##p < 0.01 and ###p < 0.001 vs. AP + TAGLN2 WT. AP, acute pancreatitis; ELISA, enzyme-linked immunosorbent assay; IL, interleukin; KO, knock out; TAGLN2, transgelin-2; WT, wild type.")
; B, lipid deposition in the aortic root analyzed using Oil Red O staining (n = 6); C, necrotic core area in the aortic root examined by HE staining (n = 6); D, measurement of serum levels of HDL, LDL, TG, and TC (n = 6); E‒G, double-positive staining of F4/80 and TUNEL (E), N-GSDMD (F), and cleaved-caspase 1 (G) to analyze macrophage pyroptosis in the aortic root (n = 6); H, serum levels of the pro-pyroptotic cytokines IL-18 and IL-1β in mice determined utilizing ELISA kits (n = 6). Differences were compared by the one-way ANOVA followed by Tukey’s post hoc test. Each dot represents an independent experiment.")
. A Western blot analysis of GSDMD and GSDMD-N protein expression after the addition of VSV-CHIKV. B Expression of the GSDMD-N protein in the cytoplasm of cells after VSV-CHIKV infection of B16 cells. GSDMD-N, red; DAPI, blue (scale bar: 10 μm). ***P")
 HKL cytotoxicity to IEC-6 cells was measured using a CCK-8 assay (n=3). (B) The effect of HKL on the cell viability of H/R-treated IEC-6 cells was revealed using a CCK-8 assay (n=3). (C) The effect of HKL on cell injury was investigated by analyzing the LDH levels in cell supernatants from H/R-treated IEC-6 cells (n=3). (D) Western blotting assays were used to reveal the effect of HKL on GSDMD-FL and GSDMD-N expression levels in IEC-6 cells following H/R (n=3). (E) IF staining assays were used to demonstrate the effect of HKL on GSDMD-N expression levels in IEC-6 cells following H/R (magnification, ×200; scale bar, 100 µm; n=3). (F) Western blotting assays were used to reveal the effects of HKL on the protein expression levels of NLRP3, Casp1-FL and cleaved-Casp1 in IEC-6 cells after H/R (n=3). (G) IF staining assays were used to demonstrate the effects of HKL on the expression levels of NLRP3 and cleaved-Casp1 in IEC-6 cells after H/R (magnification, ×200; scale bar, 100 µm; n=3). (H) ELISA assays were used to reveal the effect of HKL on IL-1β and IL-18 protein levels in IEC-6 cells following H/R (n=3). *P")
 HKL cytotoxicity to IEC-6 cells was measured using a CCK-8 assay (n=3). (B) The effect of HKL on the cell viability of H/R-treated IEC-6 cells was revealed using a CCK-8 assay (n=3). (C) The effect of HKL on cell injury was investigated by analyzing the LDH levels in cell supernatants from H/R-treated IEC-6 cells (n=3). (D) Western blotting assays were used to reveal the effect of HKL on GSDMD-FL and GSDMD-N expression levels in IEC-6 cells following H/R (n=3). (E) IF staining assays were used to demonstrate the effect of HKL on GSDMD-N expression levels in IEC-6 cells following H/R (magnification, ×200; scale bar, 100 µm; n=3). (F) Western blotting assays were used to reveal the effects of HKL on the protein expression levels of NLRP3, Casp1-FL and cleaved-Casp1 in IEC-6 cells after H/R (n=3). (G) IF staining assays were used to demonstrate the effects of HKL on the expression levels of NLRP3 and cleaved-Casp1 in IEC-6 cells after H/R (magnification, ×200; scale bar, 100 µm; n=3). (H) ELISA assays were used to reveal the effect of HKL on IL-1β and IL-18 protein levels in IEC-6 cells following H/R (n=3). *P")
 reduces IIR-induced pyroptosis by increasing the SIRT3 protein levels in rats. (A) SIRT3, NLRP3, cleaved-Casp1 and GSDMD-N protein levels were measured using immunohistochemical staining assays and consecutive sectioning of the same specimen in the same area of the intestinal tissues from different treatment groups (magnification, ×100 or ×400; scale bars, 100 or 20 µm; n=6). (B) Quantification of SIRT3, NLRP3, cleaved-Casp1 and GSDMD-N expression levels after immunohistochemical staining. (C) SIRT3, NLRP3, Casp1-FL, cleaved-Casp1, GSDMD-FL and GSDMD-N protein levels were revealed using western blotting in rats following IIR and 10 mg/kg HKL treatment (n=4). (D) Serum IL-1β and IL-18 levels were analyzed using ELISA assays in rats after IIR and 10 mg/kg HKL treatment (n=6). **P")
, with comparisons made among the S. copri OMVs or LPS-treated group and the untreated control group. n = 3.")
 Western blot images of the relative expressions of NLRP3, CASP1 with C-CASP1, N-GSDMD, and IL-1β, compared with GAPDH. (B–E) Quantitative analysis of the relative expressions of NLRP3/GAPDH, C-CASP1/ CASP1, N-GSDMD/GAPDH, and IL-1β/GAPDH. (F) Representative immunofluorescence images of retinal sections limited to GCL. Sections were stained for GSDMD (red), RBPMS (green), and DAPI (blue). Scale bar = 20 µm (upper) and 5 µm (lower). (G) Quantitative analysis of fluorescence intensity of GSDMD and RBPMS-positive cells. (H) SEM images at × 1000 (upper), × 4000 (middle), × 10,000 (lower) magnification. Scale bar = 50 µm (upper) 10 µm (middle), and 5 µm (lower). (asterisk, *) Vesicles adhered to cell surface, (well number, #) rupture of cell membrane. CASP1, caspase 1; C-CASP1, cleaved-caspase 1; Con, control; IR, ischemia reperfusion; RSV, resveratrol; GCL, ganglion cell layer. One-way ANOVA was used for the comparison.")
 The expression level about TLR4 of each group. (B) The expression level about NLRP3 of each group. (C) The expression level about GSDMD-N of each group. (D) Protein bands of TLR4, NLRP3 and GSDMD-N of each group assessed by Western blot. (E) Relative protein expression level of TLR4, NLRP3 and GSDMD-N of each group assessed by Western blot. (F) The expression level about Caspase-1 of each group was detected by qPCR. (G)The expression level about IL-18 of each group was detected by qPCR. (H) The expression level about IL-1β of each group was detected by qPCR. The data were denoted as the mean ± SD (n = 3) ###P")
 RT-qPCR was performed to verify the knockdown efficiency of Malat1 in TCMK-1 cells transfected with Malat1-targeting shRNA constructs. (B) Quantification of Malat1 expression after LPS stimulation, with or without shRNA transfection. (C) ELISA measurements of IL-1β and IL-18 concentrations in the cell supernatant indicated increased inflammation in the LPS group. (D) Western blot analysis showing the protein expression levels of pyroptosis-related markers including cleaved GSDMD (GSDMD-N), full-length GSDMD, Caspase-1, and NLRP3, normalized to GAPDH. (E–G) Immunofluorescence staining of Caspase-1 (E), GSDMD (F), and NLRP3 (G) in TCMK-1 cells following LPS induction, with or without Malat1 knockdown. Red fluorescence indicates protein expression, and Hoechst (blue) labels nuclei. Quantification of fluorescence intensity is shown at right. All experiments were independently repeated three times.")
 Schematic illustration of CLBRP-mediated pyroptosis (created in BioRender.com). (B, C) Fluorescence images and intracellular Ca2+ levels detected by the Fluo-4 AM probe were quantified in cells (scale bar = 25 μm). (D) Differences in Na+/K+-ATPase activity after treatment with different drugs. (E, F) Mitochondrial membrane potential measured by JC-1 and corresponding quantitative analysis in cells (scale bar = 50 μm). IL-18 (G) and IL-1β (H) release in the different groups. (I, J) Caspase-1 immunofluorescence images and corresponding quantitative analysis of cells following various treatments (scale bar = 50 μm). (K) Western blot of the pyroptosis-related proteins caspase-1, cleaved caspase-1, and GSDMD-N (n = 6). The data are shown as the means ± SDs. Statistical significance was determined by one-way ANOVA with Tukey's two-tailed LSD multiple-comparisons test: ns, not significant; ∗P < 0.05, ∗∗P < 0.01.")
 Detection of RAW264.7 cell viability measured using CCK8 assay. Data are expressed as means ± SDs, n = 3, ⁎p < 0.05 vs. the control group; #p < 0.05 vs. the LPS/ATP group; ●P")
製品説明
*The optimal dilutions should be determined by the end user. For optimal experimental results, antibody reuse is not recommended.
*Tips:
WB: For western blot detection of denatured protein samples. IHC: For immunohistochemical detection of paraffin sections (IHC-p) or frozen sections (IHC-f) of tissue samples. IF/ICC: For immunofluorescence detection of cell samples. ELISA(peptide): For ELISA detection of antigenic peptide.
折りたたみ/展開
1810036L03Rik; DF 5L; DF5L; DFNA 5L; DFNA5L; FKSG 10; FKSG10; FLJ12150; Gasdermin D; Gasdermin domain containing 1; Gasdermin domain containing protein 1; Gasdermin domain-containing protein 1; Gasdermin-D; GasderminD; GSDMD; GSDMD_HUMAN; GSDMDC 1; GSDMDC1;
免疫原
A synthesized peptide derived from Mouse GSDMD.
参考文献

Application: WB Species: Mouse Sample: CT26 cells

Application: WB Species: Mouse Sample: livers

Application: WB Species: Mouse Sample:

Application: WB Species: Mouse Sample: RAW264.7 cells

Application: WB Species: Mouse Sample:
Restrictive clause
Affinity Biosciences tests all products strictly. Citations are provided as a resource for additional applications that have not been validated by Affinity Biosciences. Please choose the appropriate format for each application and consult Materials and Methods sections for additional details about the use of any product in these publications.
For Research Use Only.
Not for use in diagnostic or therapeutic procedures. Not for resale. Not for distribution without written consent. Affinity Biosciences will not be held responsible for patent infringement or other violations that may occur with the use of our products. Affinity Biosciences, Affinity Biosciences Logo and all other trademarks are the property of Affinity Biosciences LTD.