, using Phospho-MYPT1 (Ser472) Antibody at 1/1000 dilution.
5ug/NC membrane strip.
Exposure for 30s with Affinity™ ECL Kit(#KF8003).
Bands result from membrane strip incubation.")
| 製品: | Phospho-MYPT1 (Ser472) Antibody |
| カタログ: | AF3779 |
| タンパク質の説明: | Rabbit polyclonal antibody to Phospho-MYPT1 (Ser472) |
| アプリケーション: | WB |
| Cited expt.: | WB |
| 反応性: | Human, Mouse, Rat |
| 分子量: | 115kD(Observed); 115kD(Calculated). |
| ユニプロット: | O14974 |
| RRID: | AB_2847093 |
製品説明
*The optimal dilutions should be determined by the end user. For optimal experimental results, antibody reuse is not recommended.
*Tips:
WB: For western blot detection of denatured protein samples. IHC: For immunohistochemical detection of paraffin sections (IHC-p) or frozen sections (IHC-f) of tissue samples. IF/ICC: For immunofluorescence detection of cell samples. ELISA(peptide): For ELISA detection of antigenic peptide.
引用形式: Affinity Biosciences Cat# AF3779, RRID:AB_2847093.
折りたたみ/展開
M130; MBS; Myosin binding subunit; Myosin phosphatase target subunit 1; Myosin phosphatase targeting subunit 1; Myosin phosphatase-targeting subunit 1; MYPT1; MYPT1_HUMAN; PPP1R12A; Protein phosphatase 1 regulatory inhibitor subunit 12A; Protein phosphatase 1 regulatory subunit 12A; Protein phosphatase 1, regulatory (inhibitor) subunit 12A; Protein phosphatase myosin binding subunit; Protein phosphatase myosin-binding subunit;
免疫原
A synthesized peptide derived from human MYPT1 around the phosphorylation site of Ser472.
Expressed in striated muscles, specifically in type 2a fibers (at protein level).
- O14974 MYPT1_HUMAN:
- Protein BLAST With
- NCBI/
- ExPASy/
- Uniprot
MKMADAKQKRNEQLKRWIGSETDLEPPVVKRQKTKVKFDDGAVFLAACSSGDTDEVLKLLHRGADINYANVDGLTALHQACIDDNVDMVKFLVENGANINQPDNEGWIPLHAAASCGYLDIAEFLIGQGAHVGAVNSEGDTPLDIAEEEAMEELLQNEVNRQGVDIEAARKEEERIMLRDARQWLNSGHINDVRHAKSGGTALHVAAAKGYTEVLKLLIQAGYDVNIKDYDGWTPLHAAAHWGKEEACRILVDNLCDMEMVNKVGQTAFDVADEDILGYLEELQKKQNLLHSEKRDKKSPLIESTANMDNNQSQKTFKNKETLIIEPEKNASRIESLEQEKVDEEEEGKKDESSCSSEEDEEDDSESEAETDKTKPLASVTNANTSSTQAAPVAVTTPTVSSGQATPTSPIKKFPTTATKISPKEEERKDESPATWRLGLRKTGSYGALAEITASKEGQKEKDTAGVTRSASSPRLSSSLDNKEKEKDSKGTRLAYVAPTIPRRLASTSDIEEKENRDSSSLRTSSSYTRRKWEDDLKKNSSVNEGSTYHKSCSFGRRQDDLISSSVPSTTSTPTVTSAAGLQKSLLSSTSTTTKITTGSSSAGTQSSTSNRLWAEDSTEKEKDSVPTAVTIPVAPTVVNAAASTTTLTTTTAGTVSSTTEVRERRRSYLTPVRDEESESQRKARSRQARQSRRSTQGVTLTDLQEAEKTIGRSRSTRTREQENEEKEKEEKEKQDKEKQEEKKESETSREDEYKQKYSRTYDETYQRYRPVSTSSSTTPSSSLSTMSSSLYASSQLNRPNSLVGITSAYSRGITKENEREGEKREEEKEGEDKSQPKSIRERRRPREKRRSTGVSFWTQDSDENEQEQQSDTEEGSNKKETQTDSISRYETSSTSAGDRYDSLLGRSGSYSYLEERKPYSSRLEKDDSTDFKKLYEQILAENEKLKAQLHDTNMELTDLKLQLEKATQRQERFADRSLLEMEKRERRALERRISEMEEELKMLPDLKADNQRLKDENGALIRVISKLSK
研究背景
Key regulator of protein phosphatase 1C (PPP1C). Mediates binding to myosin. As part of the PPP1C complex, involved in dephosphorylation of PLK1. Capable of inhibiting HIF1AN-dependent suppression of HIF1A activity.
Phosphorylated by CIT (Rho-associated kinase) (By similarity). Phosphorylated cooperatively by ROCK1 and CDC42BP on Thr-696. Phosphorylated on upon DNA damage, probably by ATM or ATR. In vitro, phosphorylation of Ser-695 by PKA and PKG appears to prevent phosphorylation of the inhibitory site Thr-696, probably mediated by PRKG1. Phosphorylation at Ser-445, Ser-472 and Ser-910 by NUAK1 promotes interaction with 14-3-3, leading to inhibit interaction with myosin light chain MLC2, preventing dephosphorylation of MLC2. May be phosphorylated at Thr-696 by DMPK; may inhibit the myosin phosphatase activity. Phosphorylated at Ser-473 by CDK1 during mitosis, creating docking sites for the POLO box domains of PLK1. Subsequently, PLK1 binds and phosphorylates PPP1R12A.
Cytoplasm. Cytoplasm>Cytoskeleton>Stress fiber.
Note: Also along actomyosin filaments.
Expressed in striated muscles, specifically in type 2a fibers (at protein level).
Heterotetramerization is mediated by the interaction between a coiled-coil of PRKG1 and the leucine/isoleucine zipper of PPP1R12A/MBS, the myosin-binding subunit of the myosin phosphatase.
The KVKF motif mediates interaction with PPP1CB.
研究領域
· Cellular Processes > Cellular community - eukaryotes > Focal adhesion. (View pathway)
· Cellular Processes > Cell motility > Regulation of actin cytoskeleton. (View pathway)
· Environmental Information Processing > Signal transduction > cGMP-PKG signaling pathway. (View pathway)
· Environmental Information Processing > Signal transduction > cAMP signaling pathway. (View pathway)
· Human Diseases > Cancers: Overview > Proteoglycans in cancer.
· Organismal Systems > Circulatory system > Vascular smooth muscle contraction. (View pathway)
· Organismal Systems > Immune system > Platelet activation. (View pathway)
· Organismal Systems > Endocrine system > Oxytocin signaling pathway.
参考文献
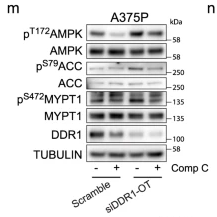
Application: WB Species: Human Sample: A375P cells
Application: WB Species: Human Sample: A375P cells

Application: WB Species: Mouse Sample: WM983B and A375M2 cells
Restrictive clause
Affinity Biosciences tests all products strictly. Citations are provided as a resource for additional applications that have not been validated by Affinity Biosciences. Please choose the appropriate format for each application and consult Materials and Methods sections for additional details about the use of any product in these publications.
For Research Use Only.
Not for use in diagnostic or therapeutic procedures. Not for resale. Not for distribution without written consent. Affinity Biosciences will not be held responsible for patent infringement or other violations that may occur with the use of our products. Affinity Biosciences, Affinity Biosciences Logo and all other trademarks are the property of Affinity Biosciences LTD.