

 and mouse anti-beta tubulin Ab(T0023 1:200) for 1 hour at 37°C. An AlexaFluor594 conjugated goat anti-rabbit IgG(H+L) Ab(Red) and an AlexaFluor488 conjugated goat anti-mouse IgG(H+L) Ab(Green) were used as the secondary antibody.
The nuclear counter stain is DAPI(blue).")
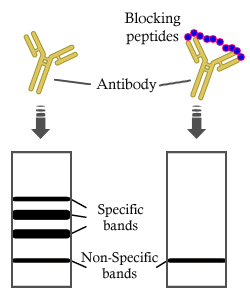
Control Products
製品説明
*The optimal dilutions should be determined by the end user. For optimal experimental results, antibody reuse is not recommended.
*Tips:
WB: For western blot detection of denatured protein samples. IHC: For immunohistochemical detection of paraffin sections (IHC-p) or frozen sections (IHC-f) of tissue samples. IF/ICC: For immunofluorescence detection of cell samples. ELISA(peptide): For ELISA detection of antigenic peptide.
引用形式: Affinity Biosciences Cat# DF12505, RRID:AB_2845310.
折りたたみ/展開
SOCS box containing WD protein SWiP 1; SWIP1; WD repeat and SOCS box containing 1; WD repeat and SOCS box containing protein 1; WSB 1;
免疫原
A synthesized peptide derived from human WSB1, corresponding to a region within the internal amino acids.
- Q9Y6I7 WSB1_HUMAN:
- Protein BLAST With
- NCBI/
- ExPASy/
- Uniprot
MASFPPRVNEKEIVRLRTIGELLAPAAPFDKKCGRENWTVAFAPDGSYFAWSQGHRTVKLVPWSQCLQNFLLHGTKNVTNSSSLRLPRQNSDGGQKNKPREHIIDCGDIVWSLAFGSSVPEKQSRCVNIEWHRFRFGQDQLLLATGLNNGRIKIWDVYTGKLLLNLVDHTEVVRDLTFAPDGSLILVSASRDKTLRVWDLKDDGNMMKVLRGHQNWVYSCAFSPDSSMLCSVGASKAVFLWNMDKYTMIRKLEGHHHDVVACDFSPDGALLATASYDTRVYIWDPHNGDILMEFGHLFPPPTPIFAGGANDRWVRSVSFSHDGLHVASLADDKMVRFWRIDEDYPVQVAPLSNGLCCAFSTDGSVLAAGTHDGSVYFWATPRQVPSLQHLCRMSIRRVMPTQEVQELPIPSKLLEFLSYRI
種類予測
Score>80(red) has high confidence and is suggested to be used for WB detection. *The prediction model is mainly based on the alignment of immunogen sequences, the results are for reference only, not as the basis of quality assurance.
High(score>80) Medium(80>score>50) Low(score<50) No confidence
研究背景
Probable substrate-recognition component of a SCF-like ECS (Elongin-Cullin-SOCS-box protein) E3 ubiquitin ligase complex which mediates the ubiquitination and subsequent proteasomal degradation of target proteins. Recognizes type II iodothyronine deiodinase/DIO2. Confers constitutive instability to HIPK2 through proteasomal degradation.
The SOCS box domain mediates the interaction with the Elongin BC complex, an adapter module in different E3 ubiquitin ligase complexes.
参考文献

Application: IF/ICC Species: Mouse Sample:
Restrictive clause
Affinity Biosciences tests all products strictly. Citations are provided as a resource for additional applications that have not been validated by Affinity Biosciences. Please choose the appropriate format for each application and consult Materials and Methods sections for additional details about the use of any product in these publications.
For Research Use Only.
Not for use in diagnostic or therapeutic procedures. Not for resale. Not for distribution without written consent. Affinity Biosciences will not be held responsible for patent infringement or other violations that may occur with the use of our products. Affinity Biosciences, Affinity Biosciences Logo and all other trademarks are the property of Affinity Biosciences LTD.